Data Observatory, Office of Studies and Statistics, Ministry of Science, Government of Chile
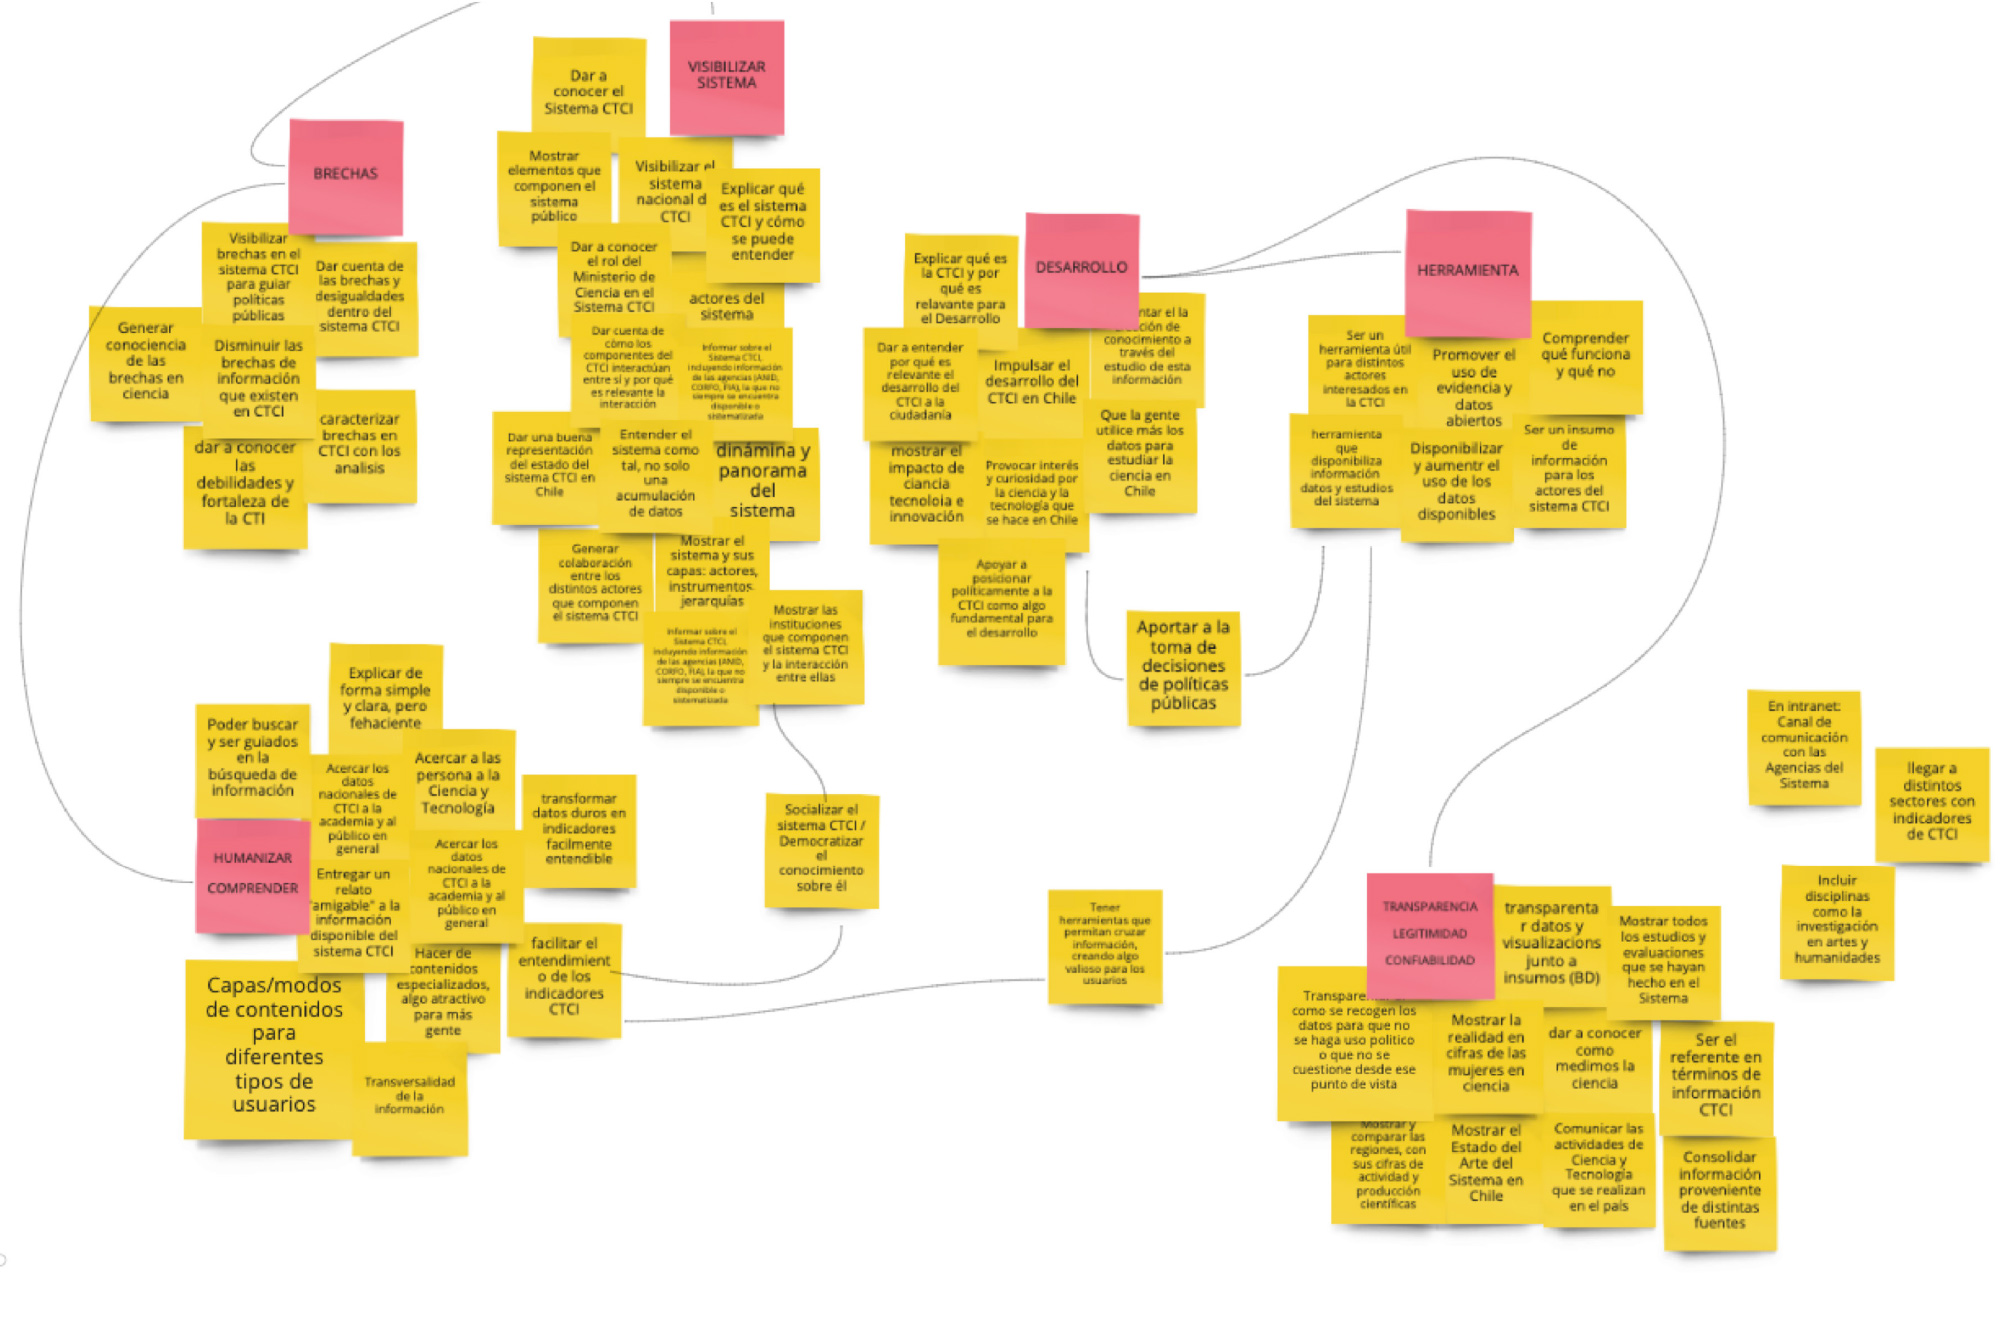
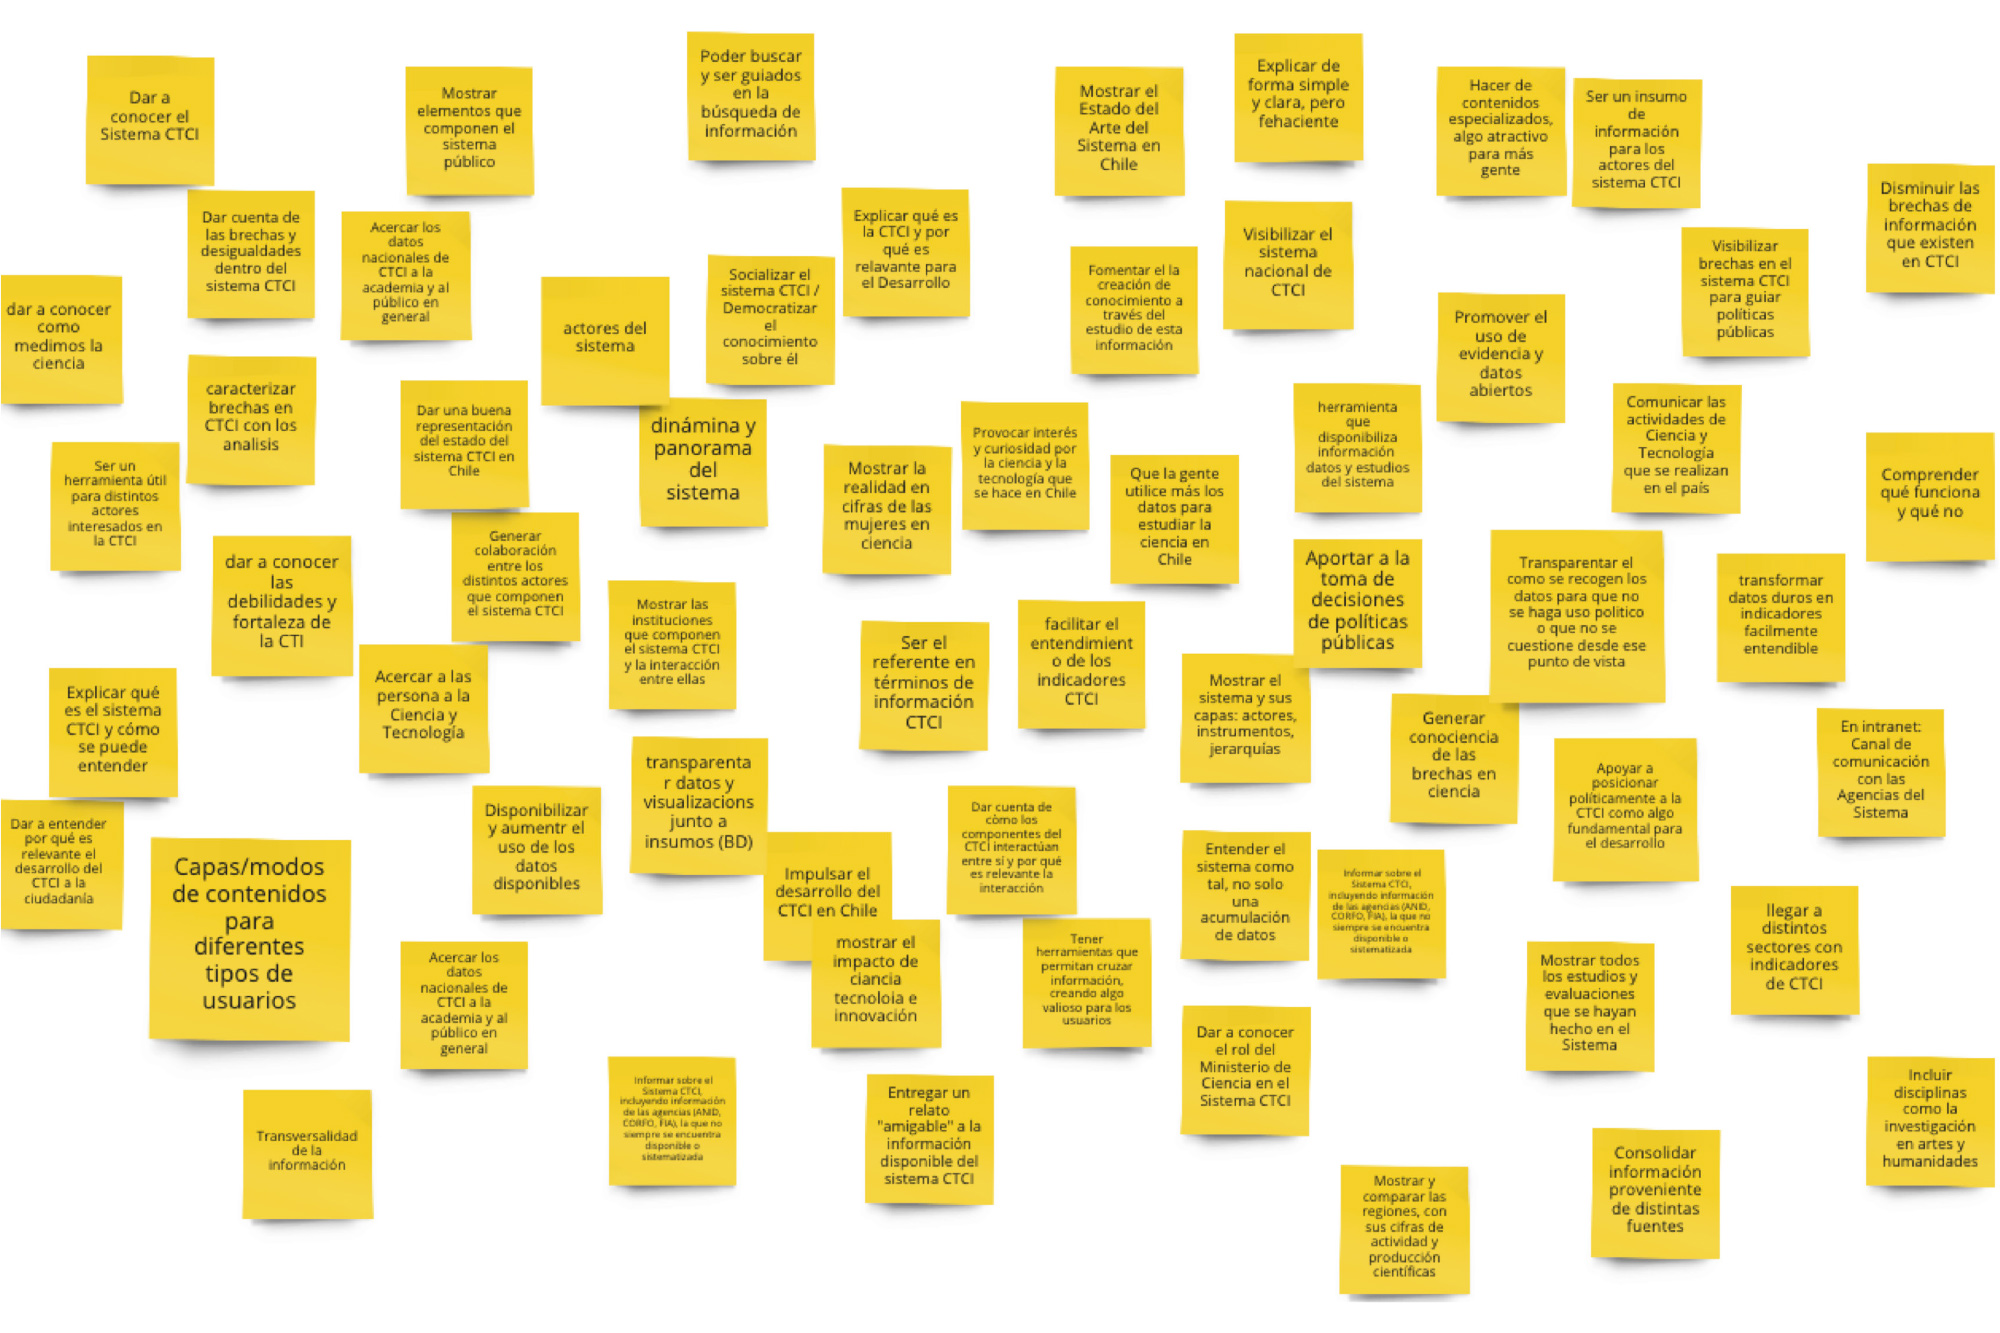
We generated instances of co-creation with stakeholders to identify, align and prioritize purposes and expectations within the ministry’s team and define the strategy. We also generated instances of research with users to create archetypes defined by motivations of use, not by formal characteristics of the users, but by the needs they need to solve when facing the site: 1) Discover, 2) Use and 3) Investigate.
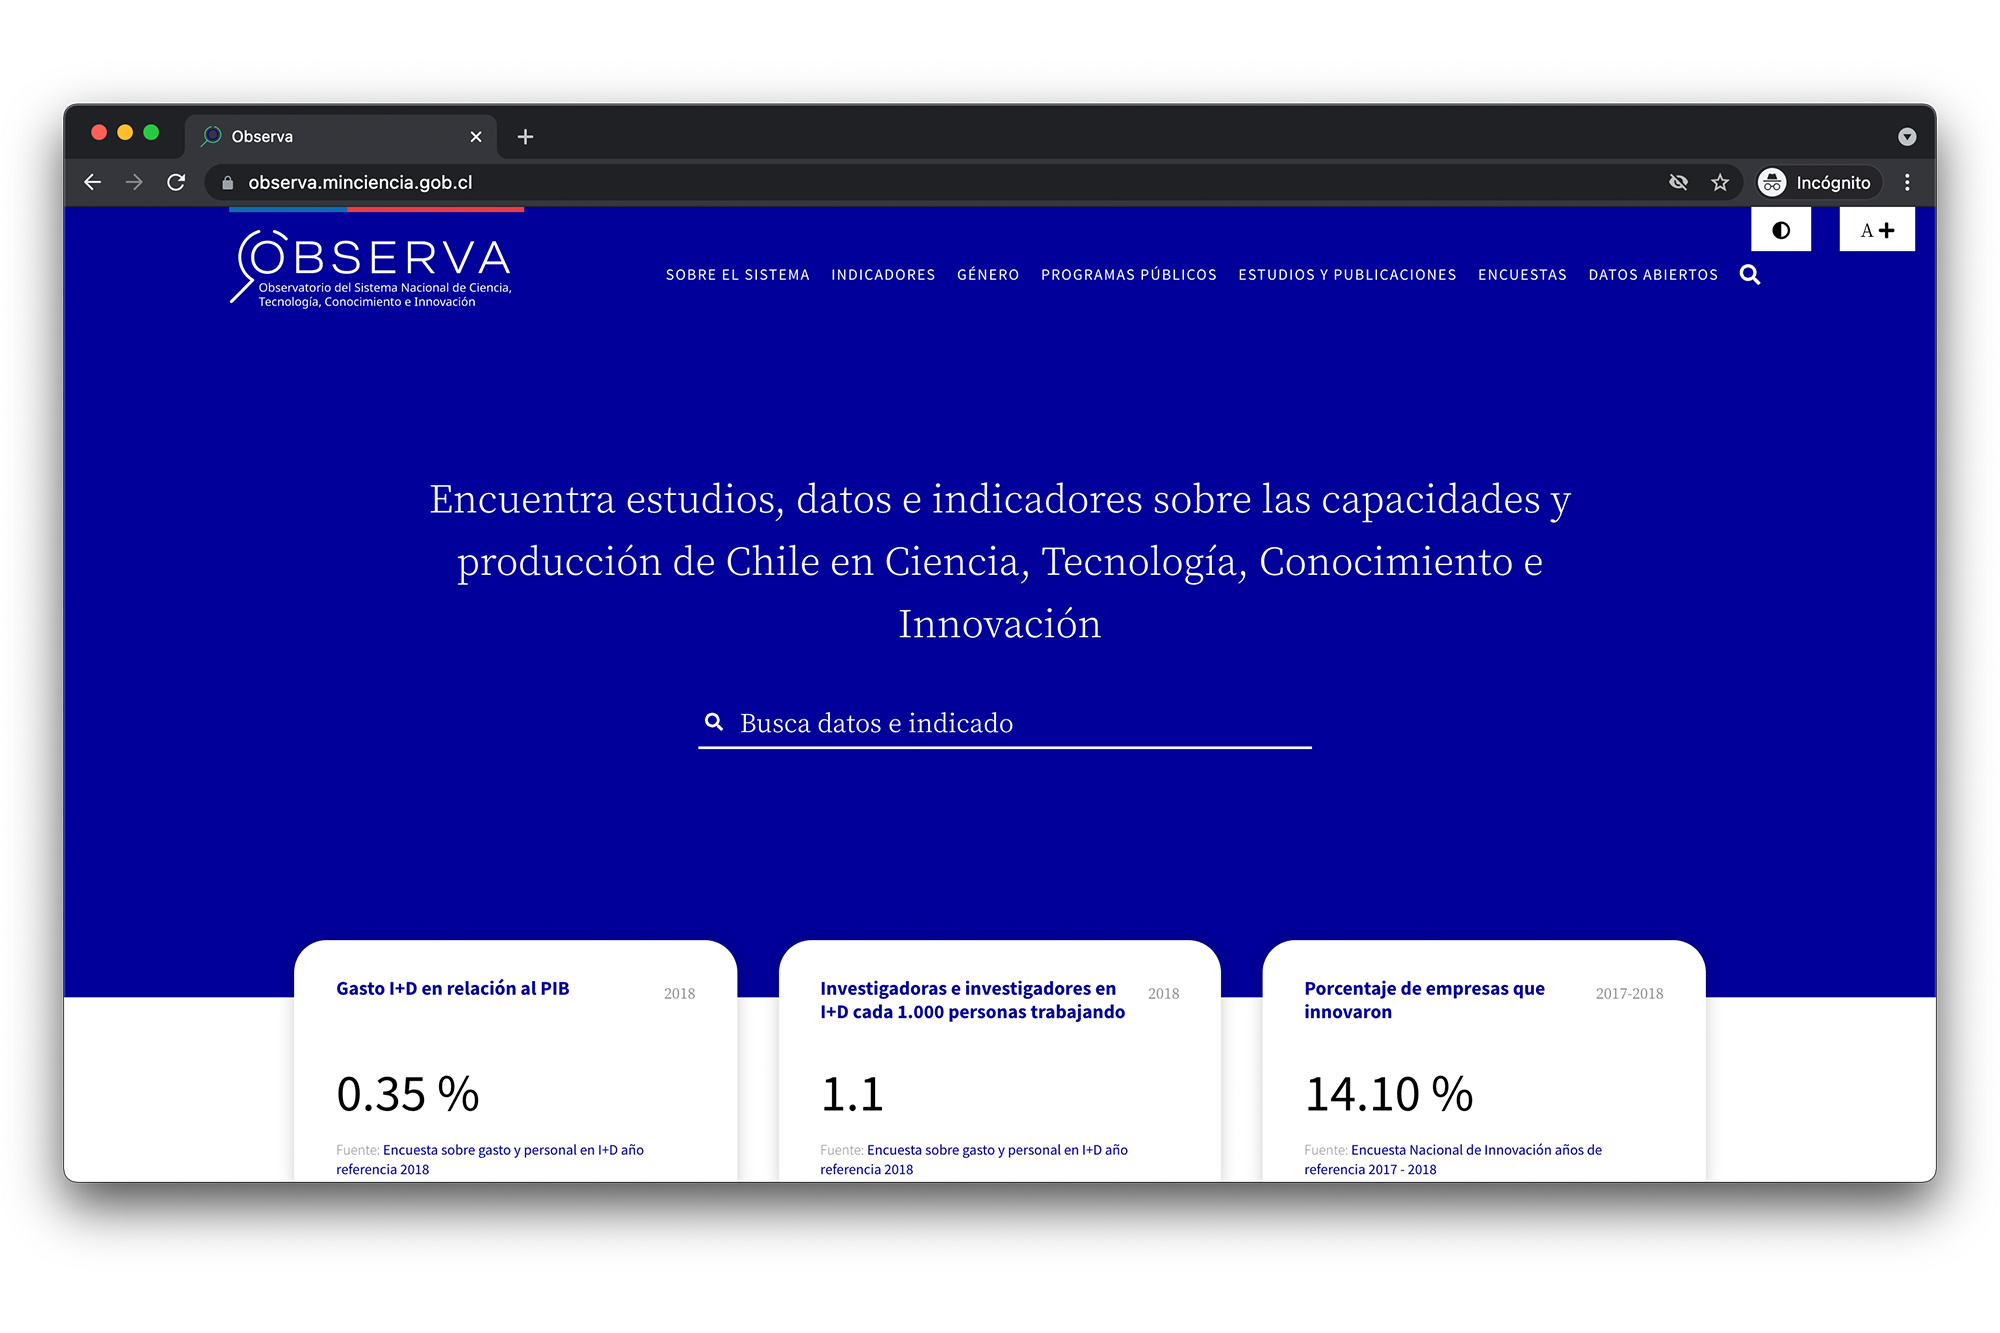
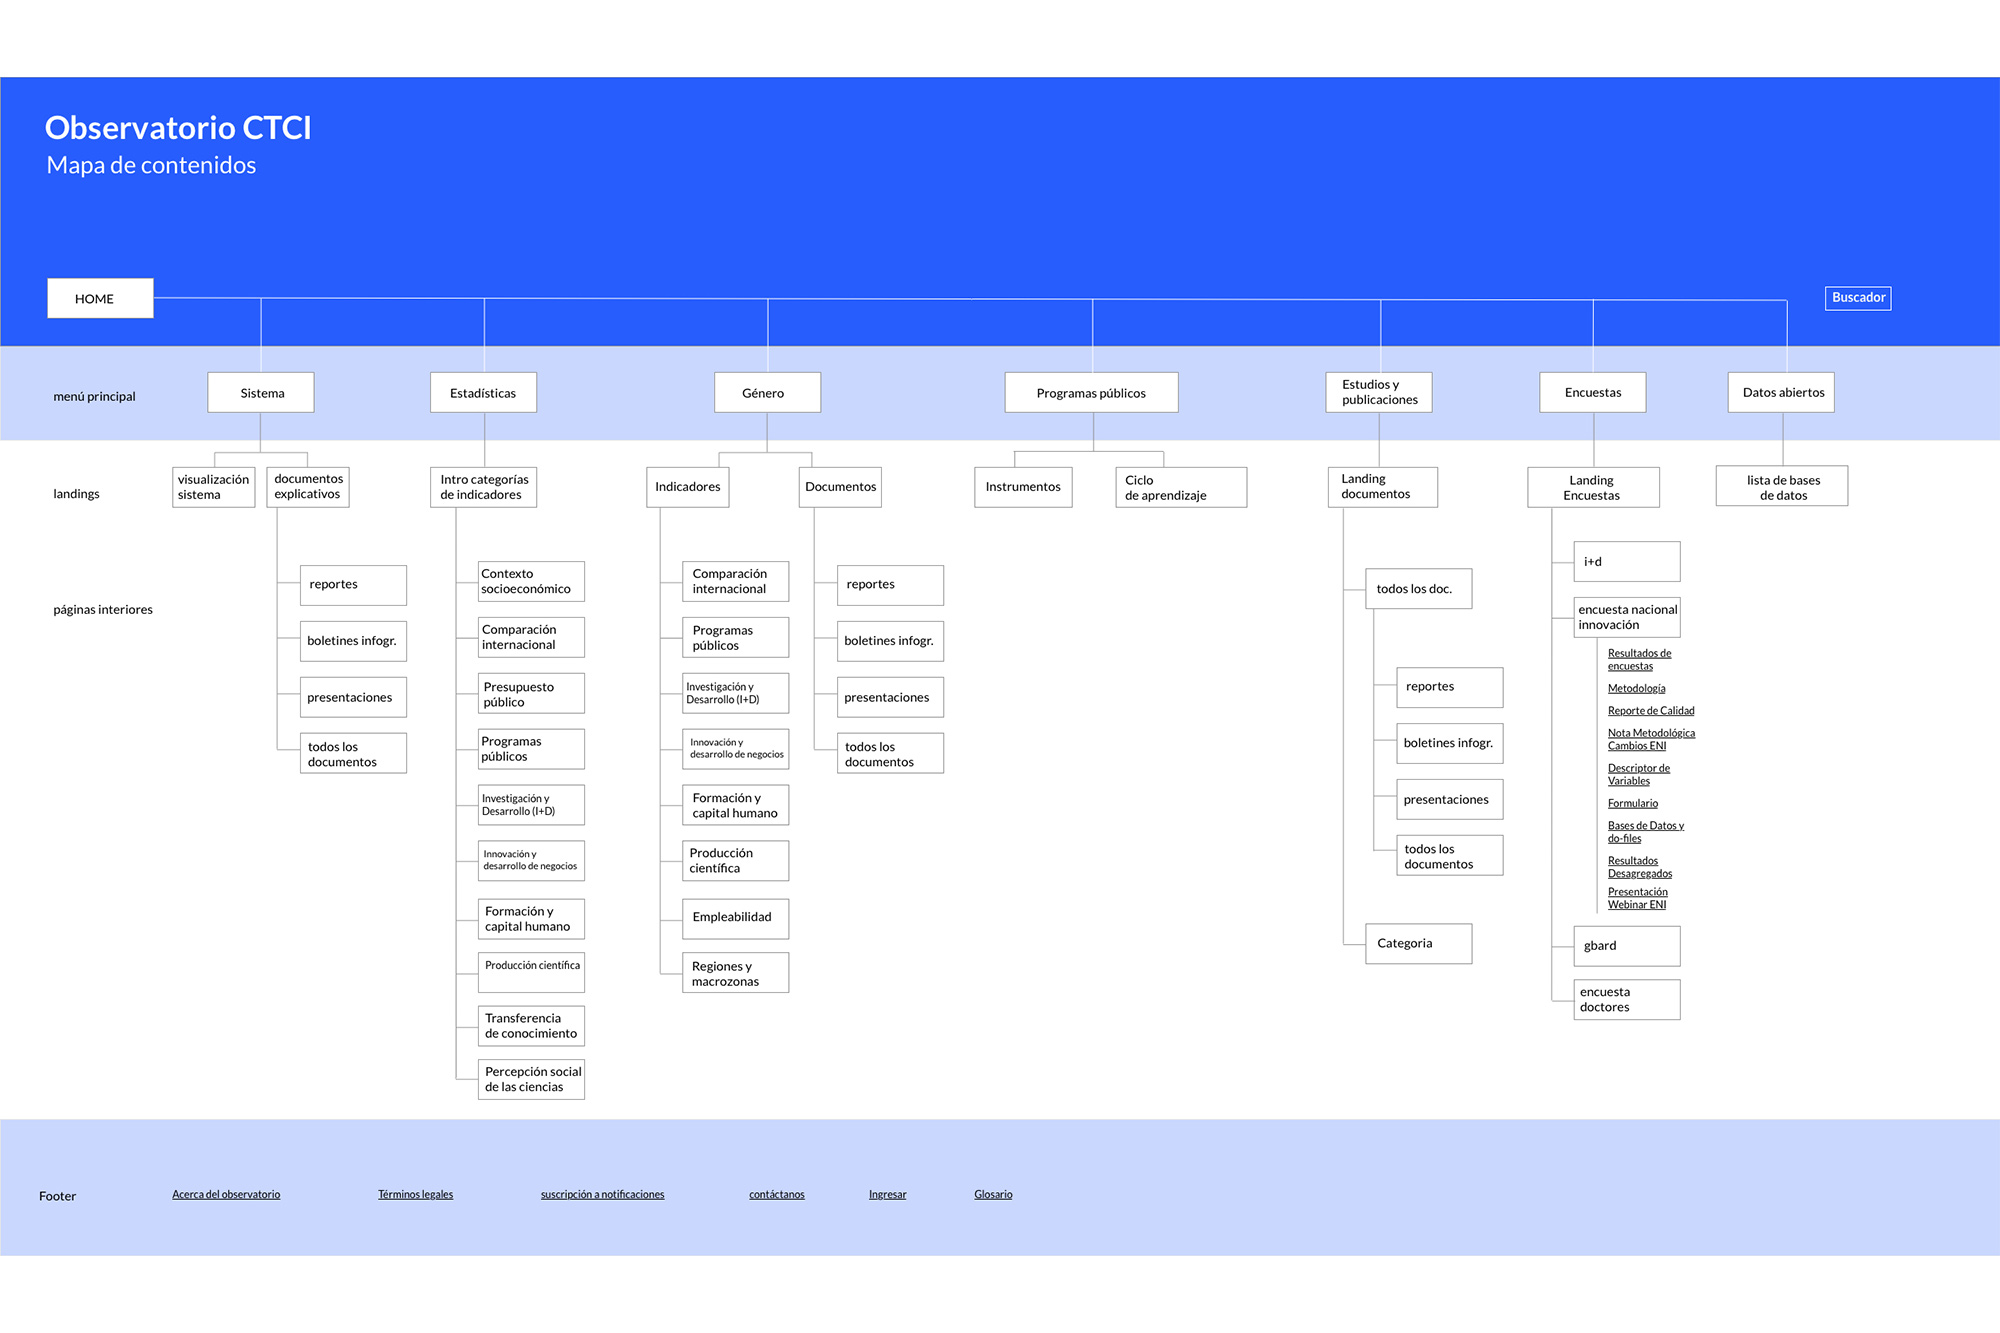
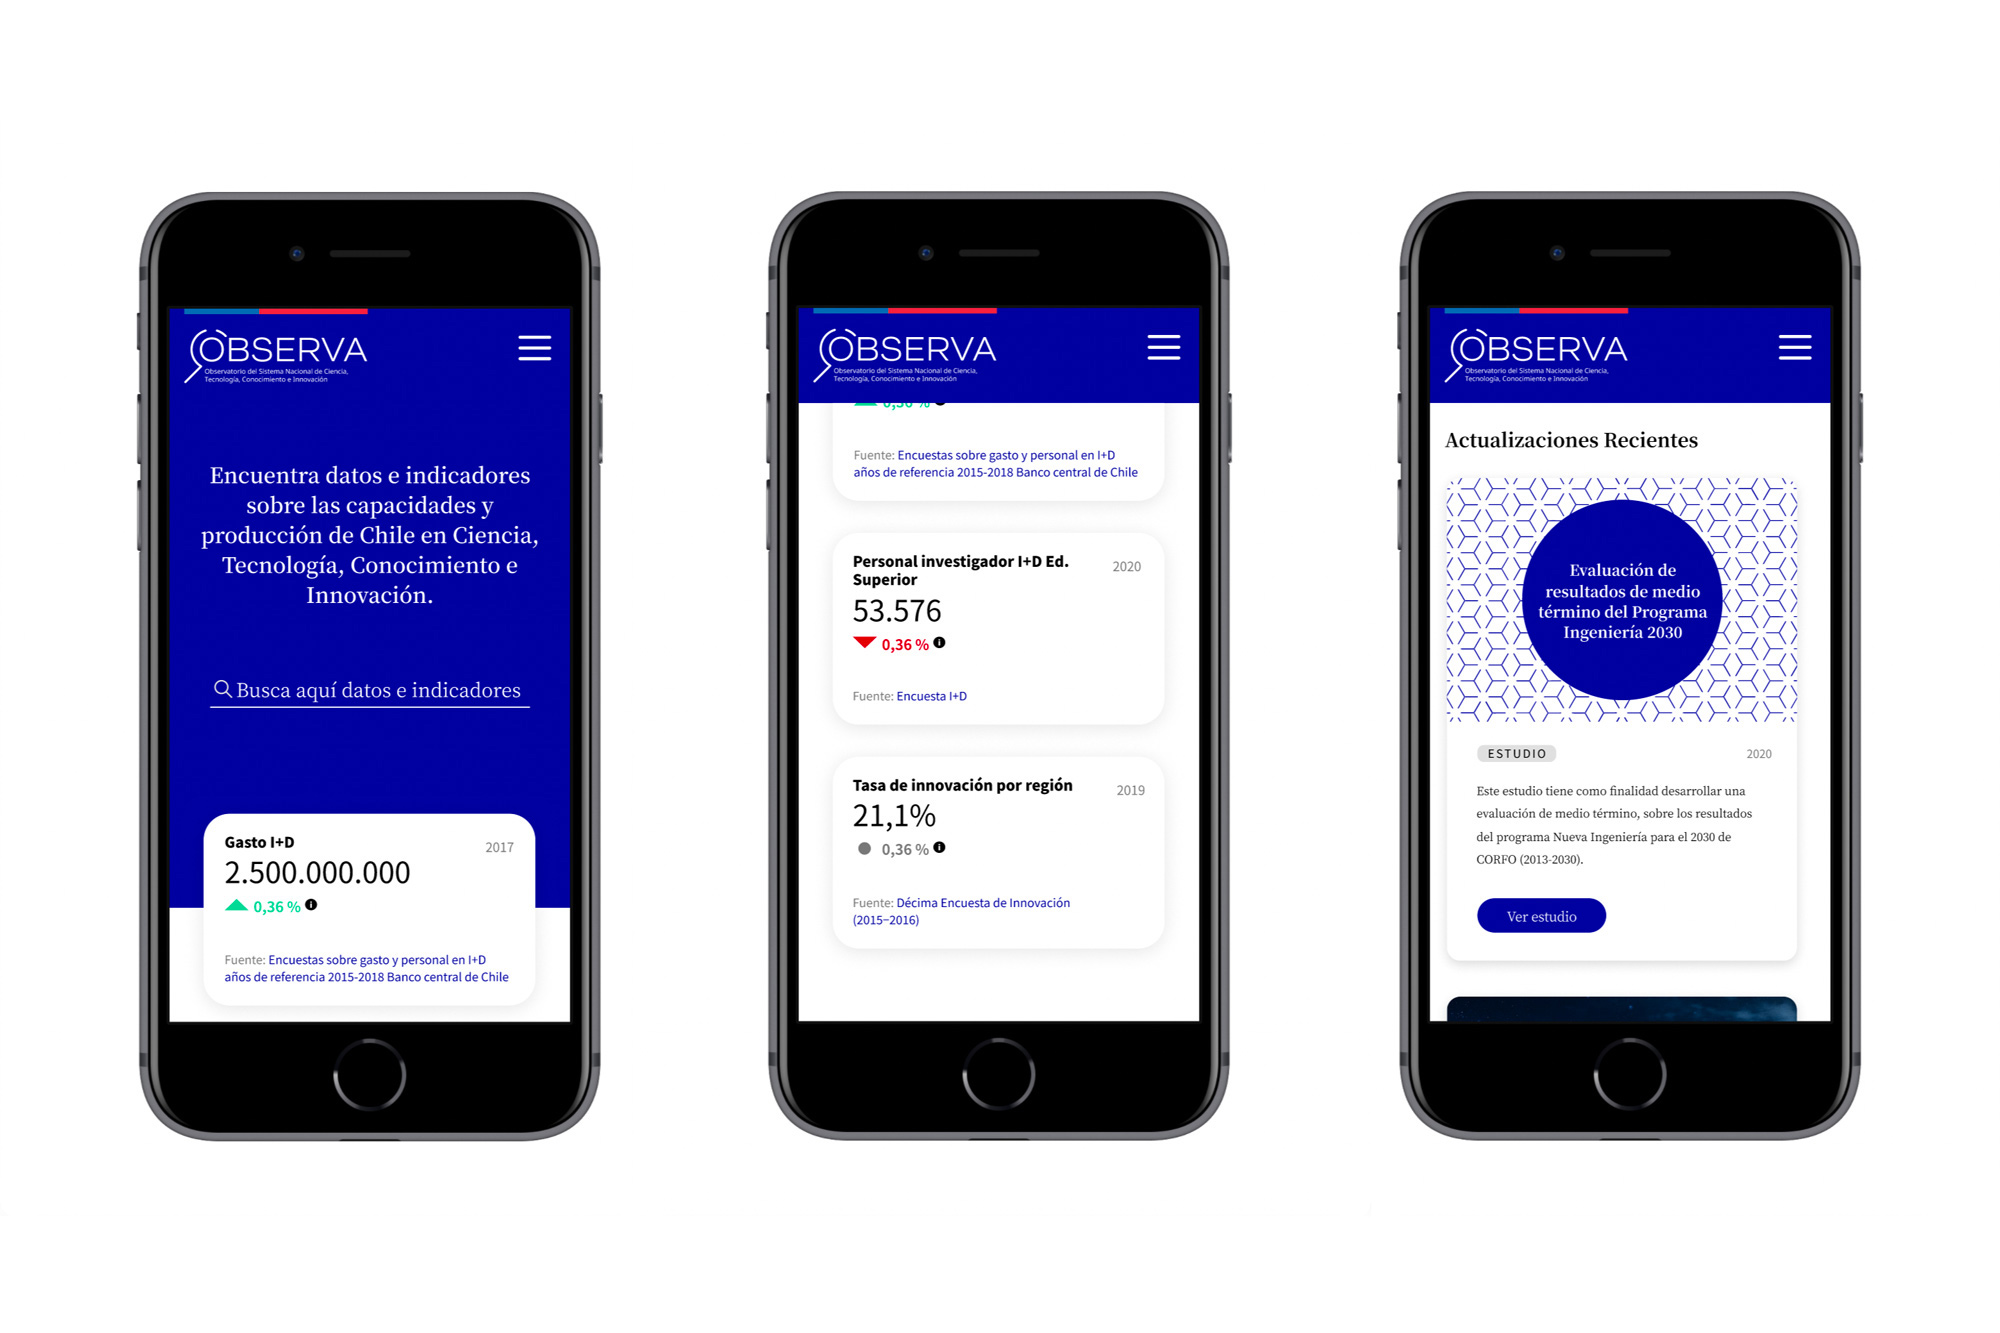
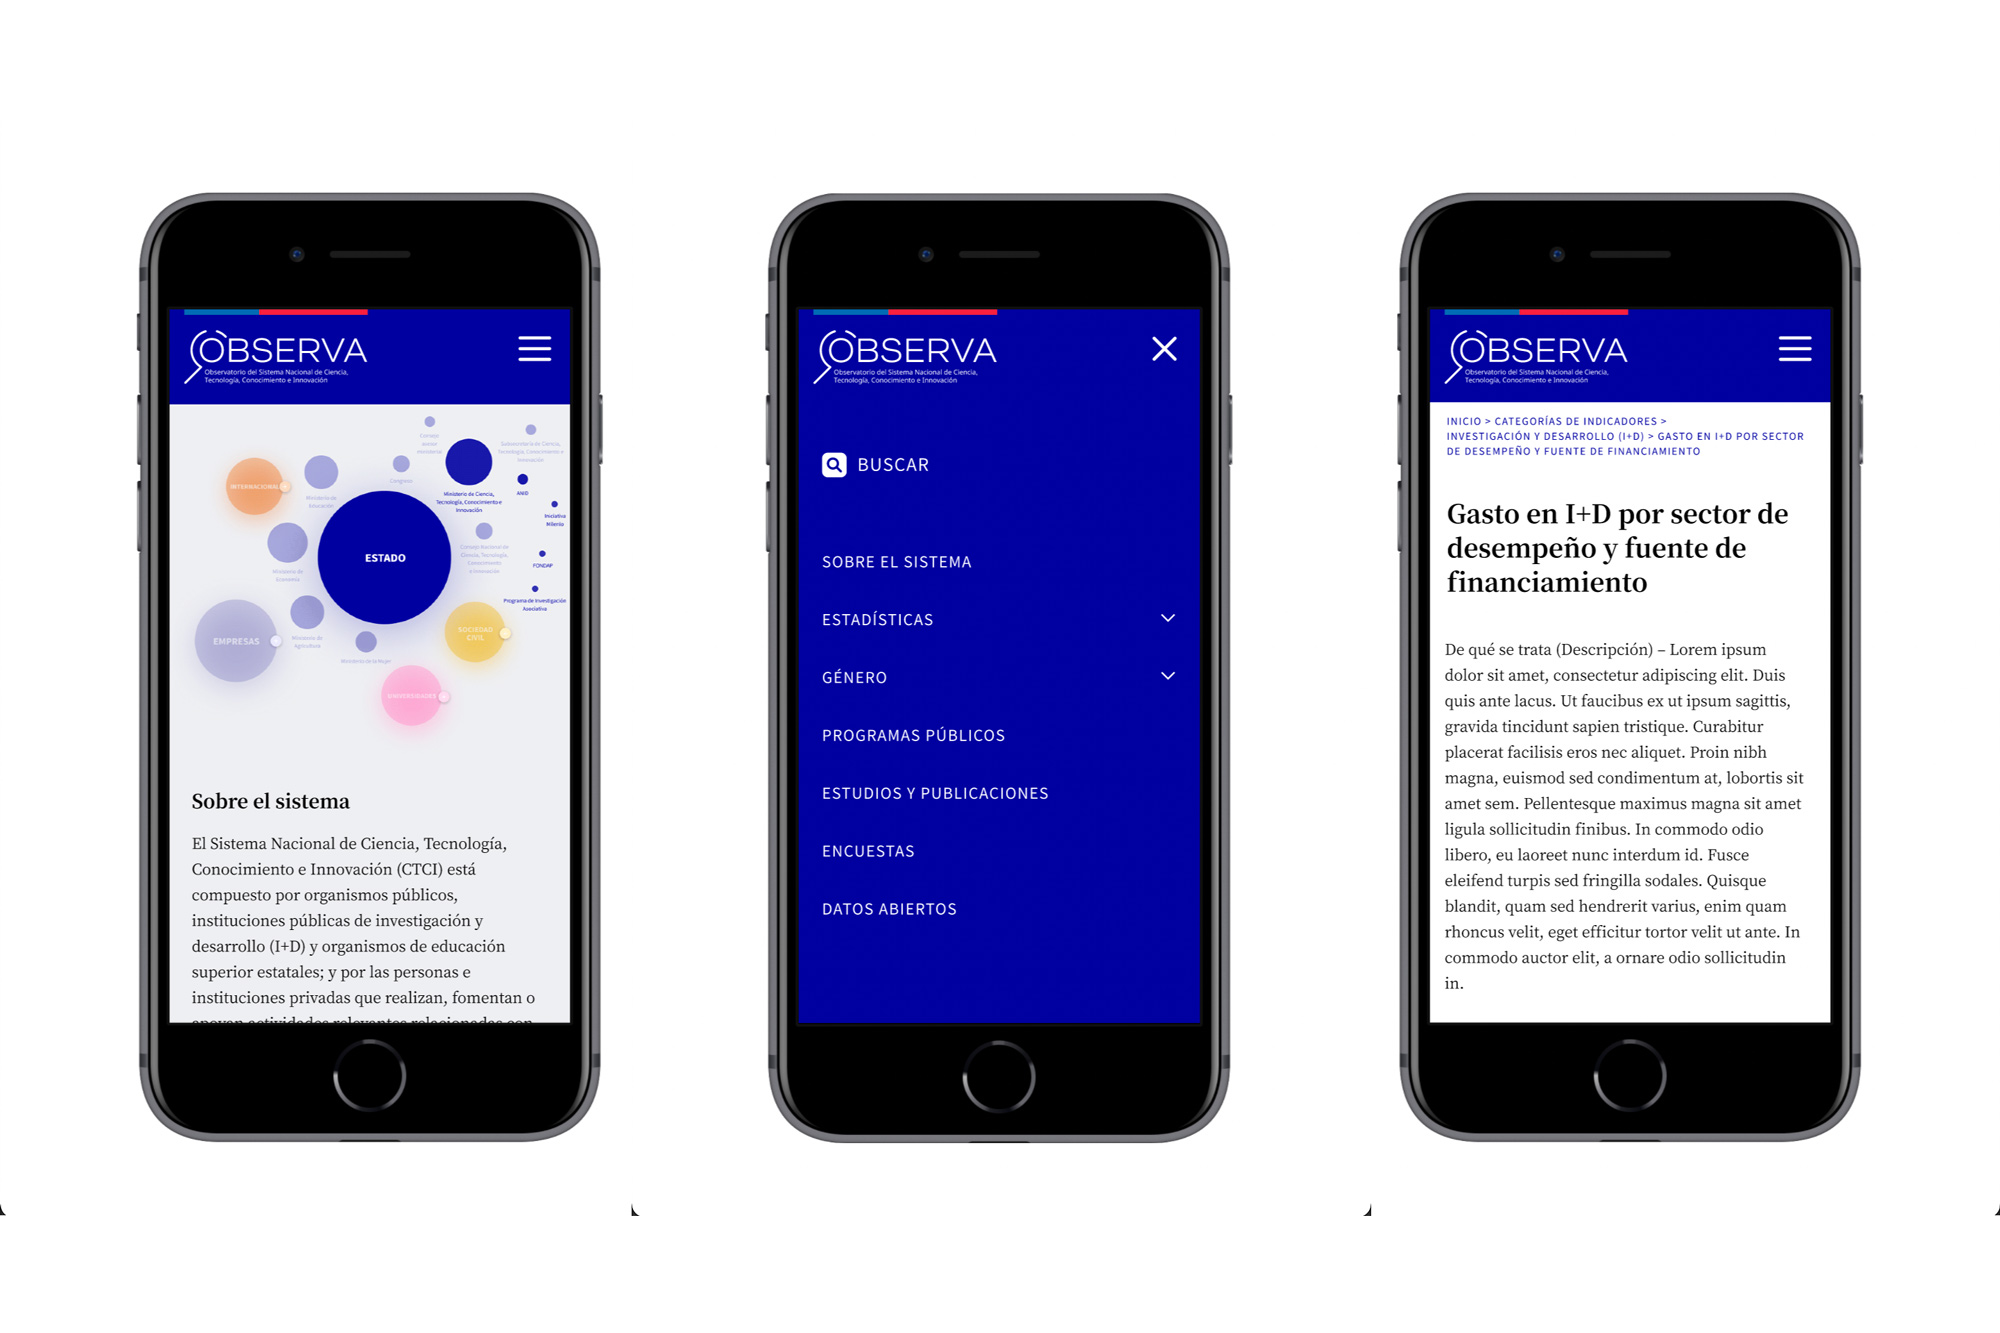
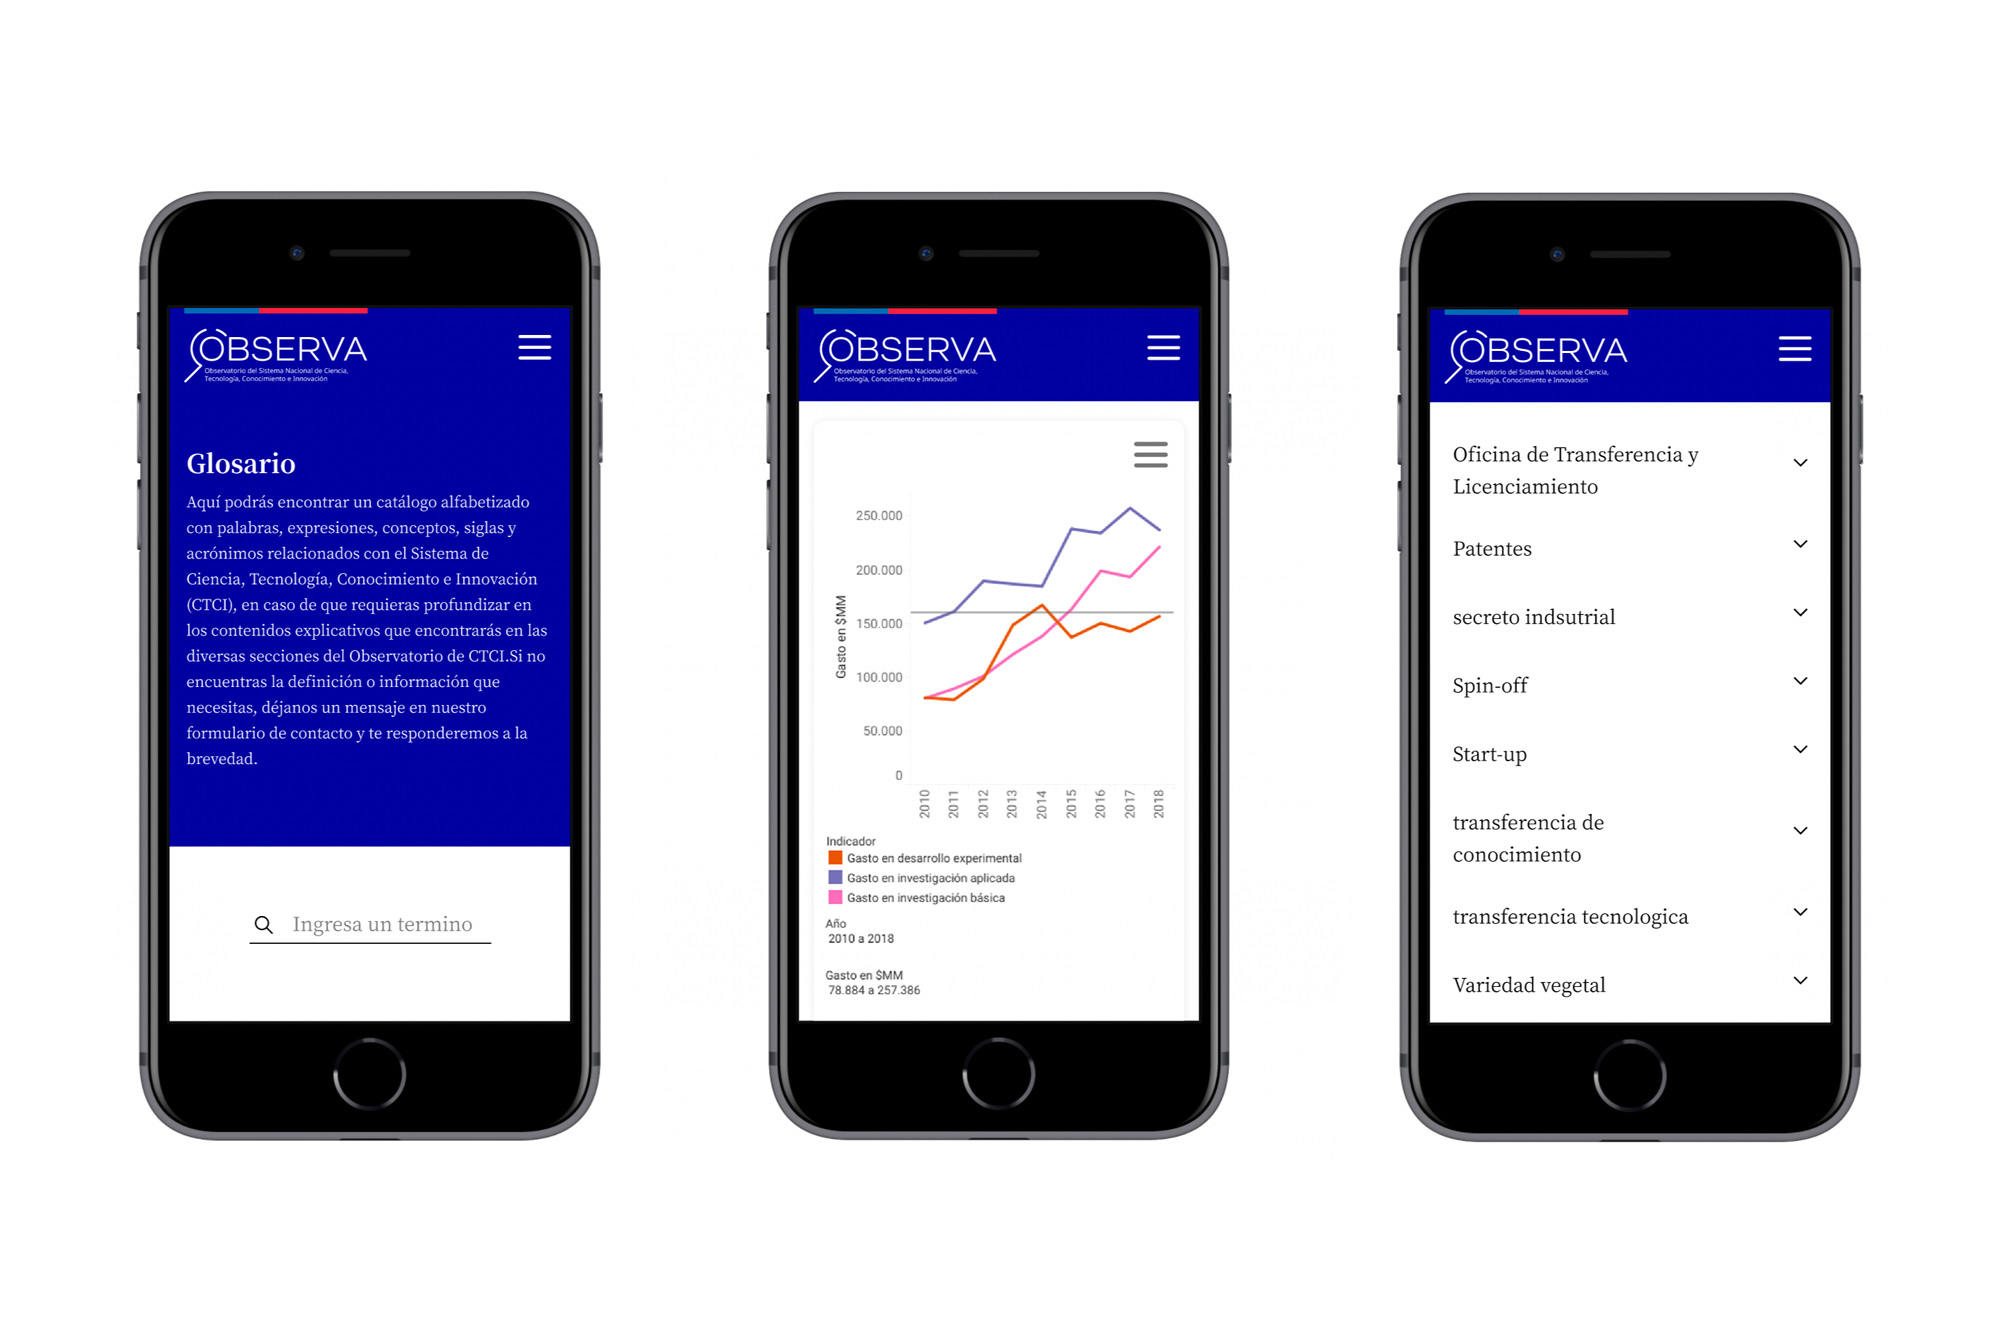
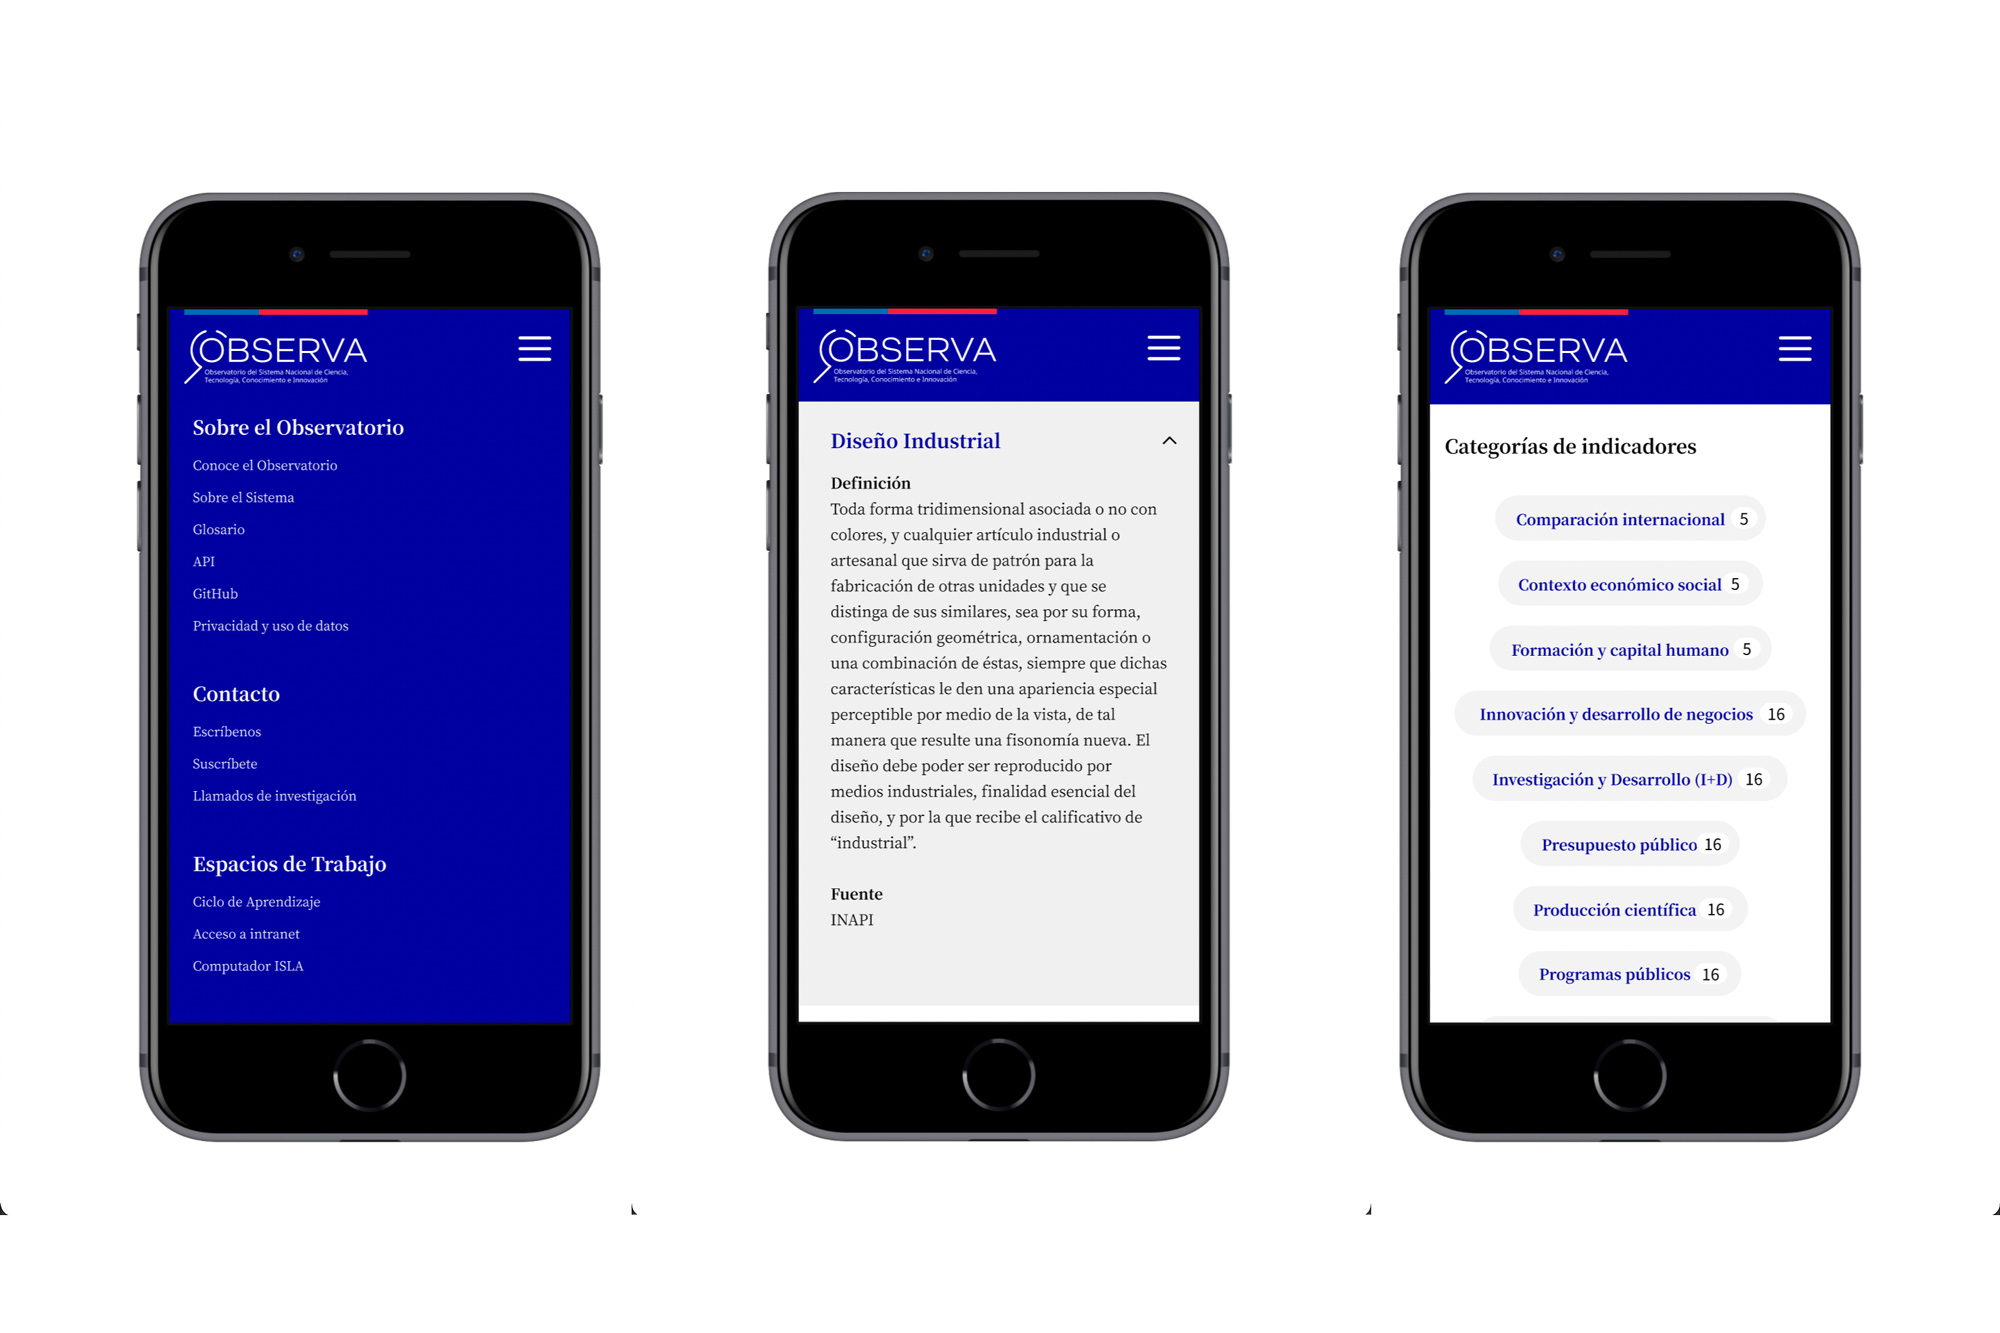
Throughout the process, benchmark, content map, wireframes, ui screens and prototyping for testing were developed. The strategy to solve the different needs of the users without having to resort to a previous profiling and design different flows for each profile was to prioritize the needs of each user according to the frequency of use of the site, from there the wireframes were built and different layers of information represented with different formal elements in the interfaces were generated, that is, the content that was related to reading was represented with Serif typographies and the content that was related to data was represented with Sans Serif typographies, so that a user that was related to reading was represented with Sans Serif typographies, Therefore, a user who is familiar with the data observatory and is clear about the indicator he/she needs to locate (and what it measures) can read only the Sans Serif typographies and find the information he/she needs, and in turn, the user who has no knowledge and needs to discover an indicator that helps to argue some research (for example), can read only the information that is represented with Serif typographies and can understand what it is and what an indicator measures.
This was decided because one of the propositions raised in the research stage, more specifically in the stakeholder alignment workshop, was that although most of the people who would visit the observatory’s website on a recurring basis, know what the observatory does, what the indicators measure or who makes up the CTCI system, but the intention was to make a site that would be citizen, open to the community and that strengthens the idea of a reliable instrument of the observatory, so that the information published can be used as an argument to generate discussions about, on the one hand, the creation of new public policies in the institutional environment, and on the other hand, the progress of a society knowing the functioning of its institutions.